Services
Latest Posts
Marx & Schumpeter's Warning: Why Finance Has Become "Parasitical" to the Real Economy Understanding the Long Wave Cycles and Creative Destruction in Today's Economic Winter The Prophetic Critique That Still Defines Our Times 🎯 In an era where financial markets reach record highs while manufacturing productivity stagnates, two of history's most influential economists offer a[...]
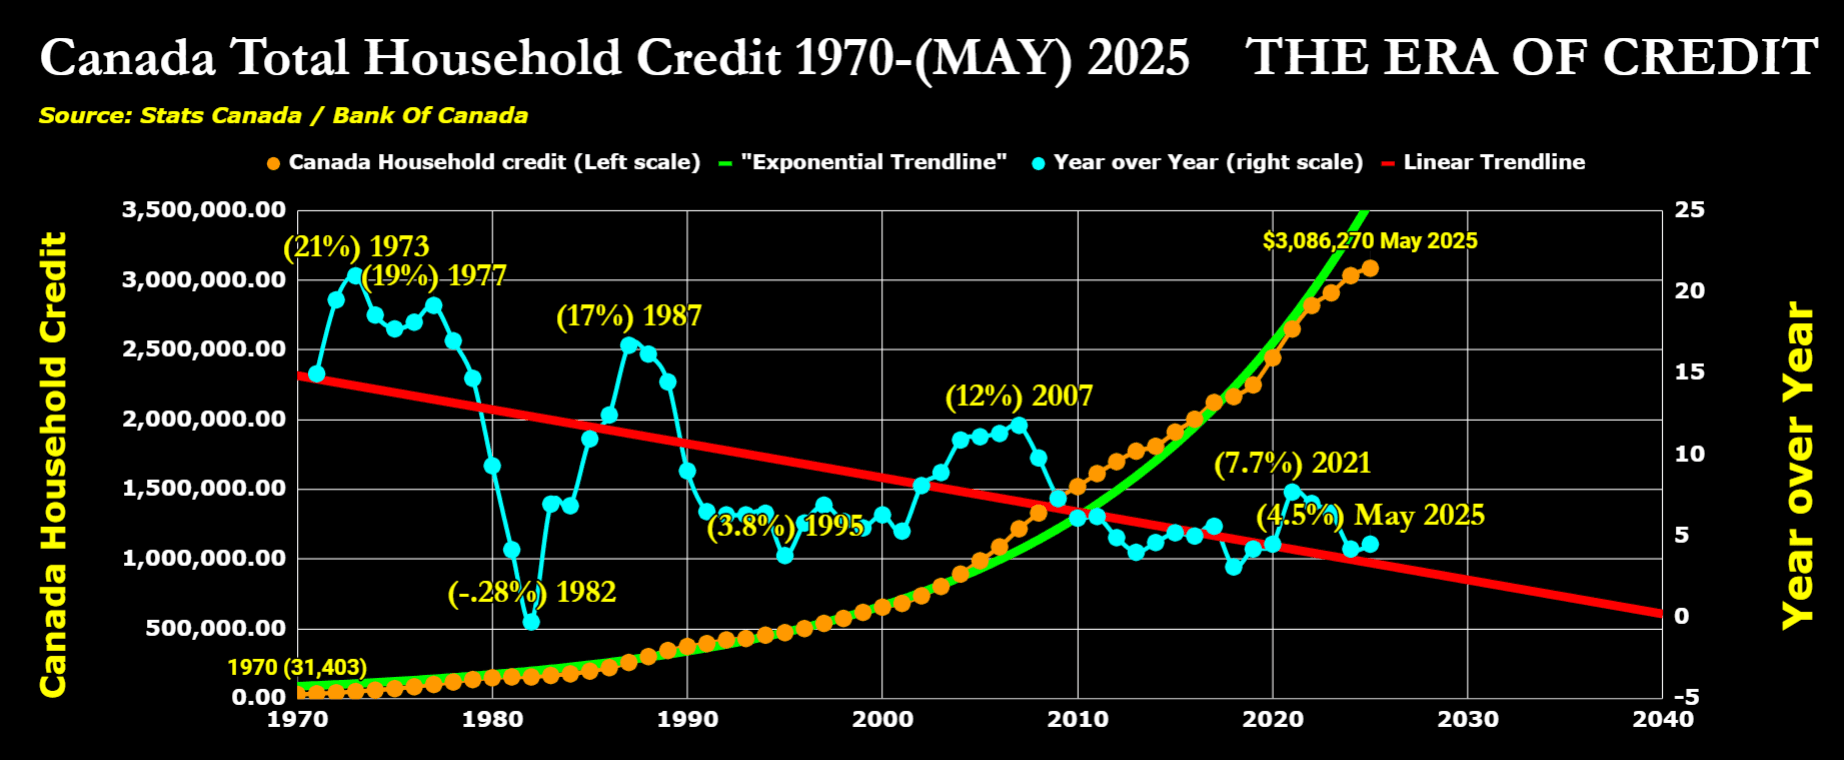
The "Era of Credit" is mathematically ending - here's what the data reveals about the 2030s transformation 📊 Canadian household credit: 9,600% growth from 1970-2025 ($31K → $3M+). But the Rate of Change (ROC) tells the REAL story of momentum breakdown: 📉 Peak Velocity (21%) - 1973 oil crisis 📉 Massive crash to -28% by[...]
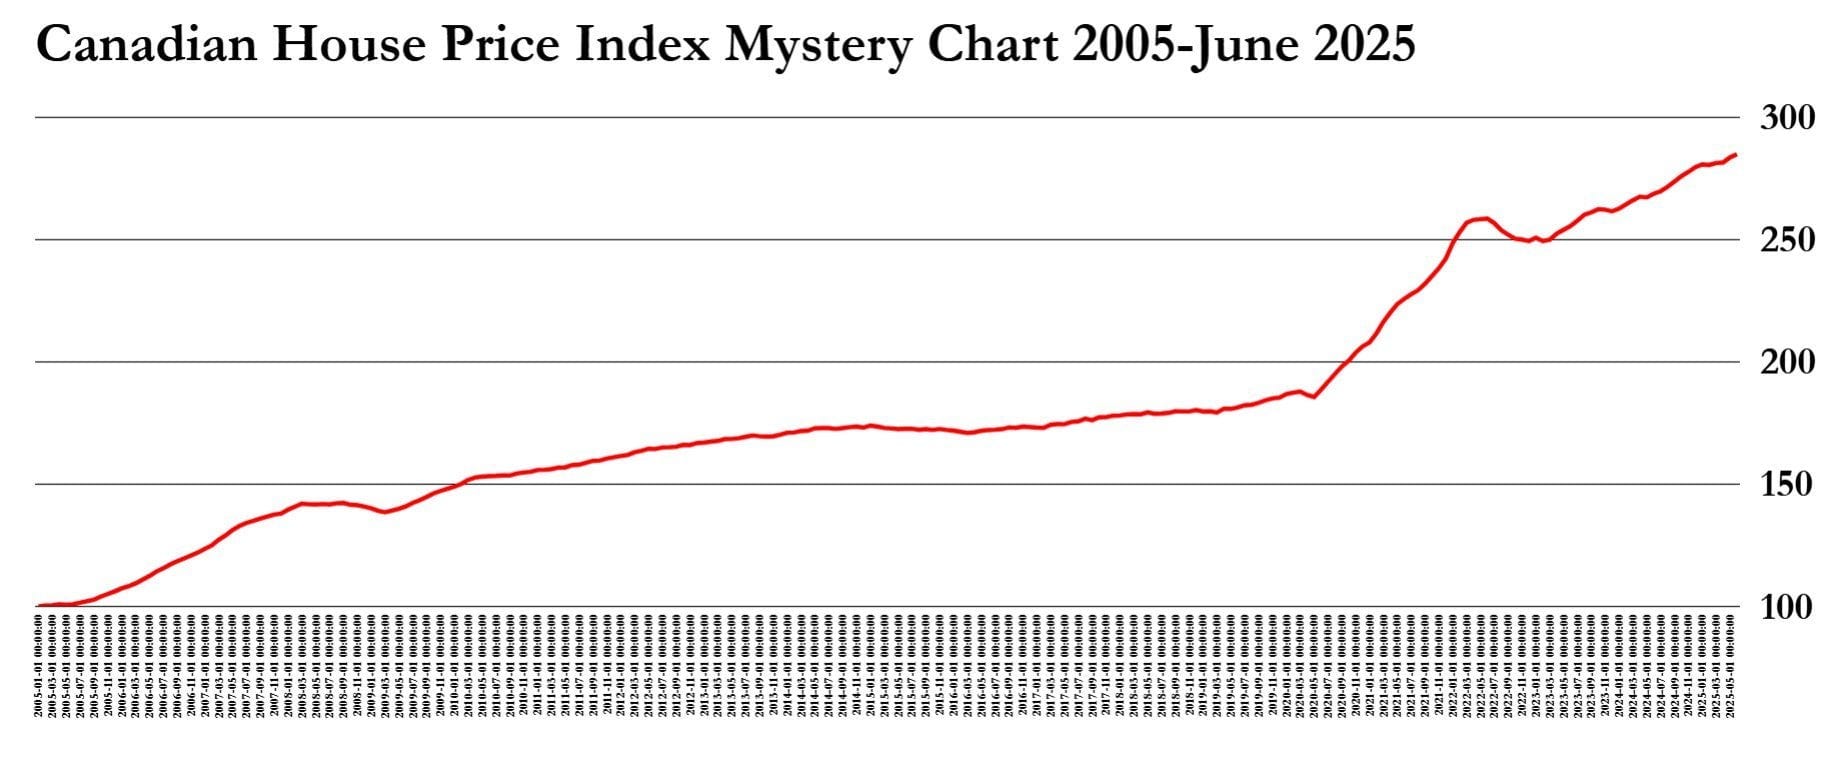
The New Home Price Index chart paints a clear picture: the Canadian real estate market seems stuck in a bearish cycle. As of December 2024, the latest data indicates a continuation of this downward trend, suggesting a sustained period of weaker demand and lower home prices. This trend is typical of a bear[...]
Canada's Perfect Storm: High Debt Service Ratios Meet Political Risk The latest Bank for International Settlements (BIS) data release for H2 2024 shows a concerning pattern for Canada's private sector Debt Service Ratio (DSR). At 24.9%, Canada's DSR towers above other developed economies, painting a picture of an economy increasingly vulnerable to financial and political[...]
Canada's Household Debt: The End of the Credit Era? The story of Canadian household debt over the past five decades reads like a cautionary tale. Recent data from Statistics Canada and the Bank of Canada paints a stark picture: Canadian households have embarked on a borrowing spree that has taken total household credit from a[...]


