- All
- 2024
- Asset Mania's
- BITCOIN
- Climate Change Bubble
- Creative Destruction
- Decentralization
- Economic Winter Watch
- Economics
- Economy
- GOLD
- Interest Rates
- Japan
- Kondratieff's Monetary Wave
- Market's
- Ponzi Finance
- Population Growth
- Questions
- Real Estate
- Recession Watch
- Schumpeter
- TELTAAM
- The Economic LongWave Podcast
- The Kondratieff Cycle
- The LongWave Model

Marx & Schumpeter's Warning: Why Finance Has Become "Parasitical" to the Real Economy Understanding the Long Wave Cycles and Creative Destruction in Today's Economic Winter The Prophetic Critique That Still Defines Our Times 🎯 In an era where financial markets reach record highs while manufacturing productivity stagnates, two of history's most influential economists offer a[...]
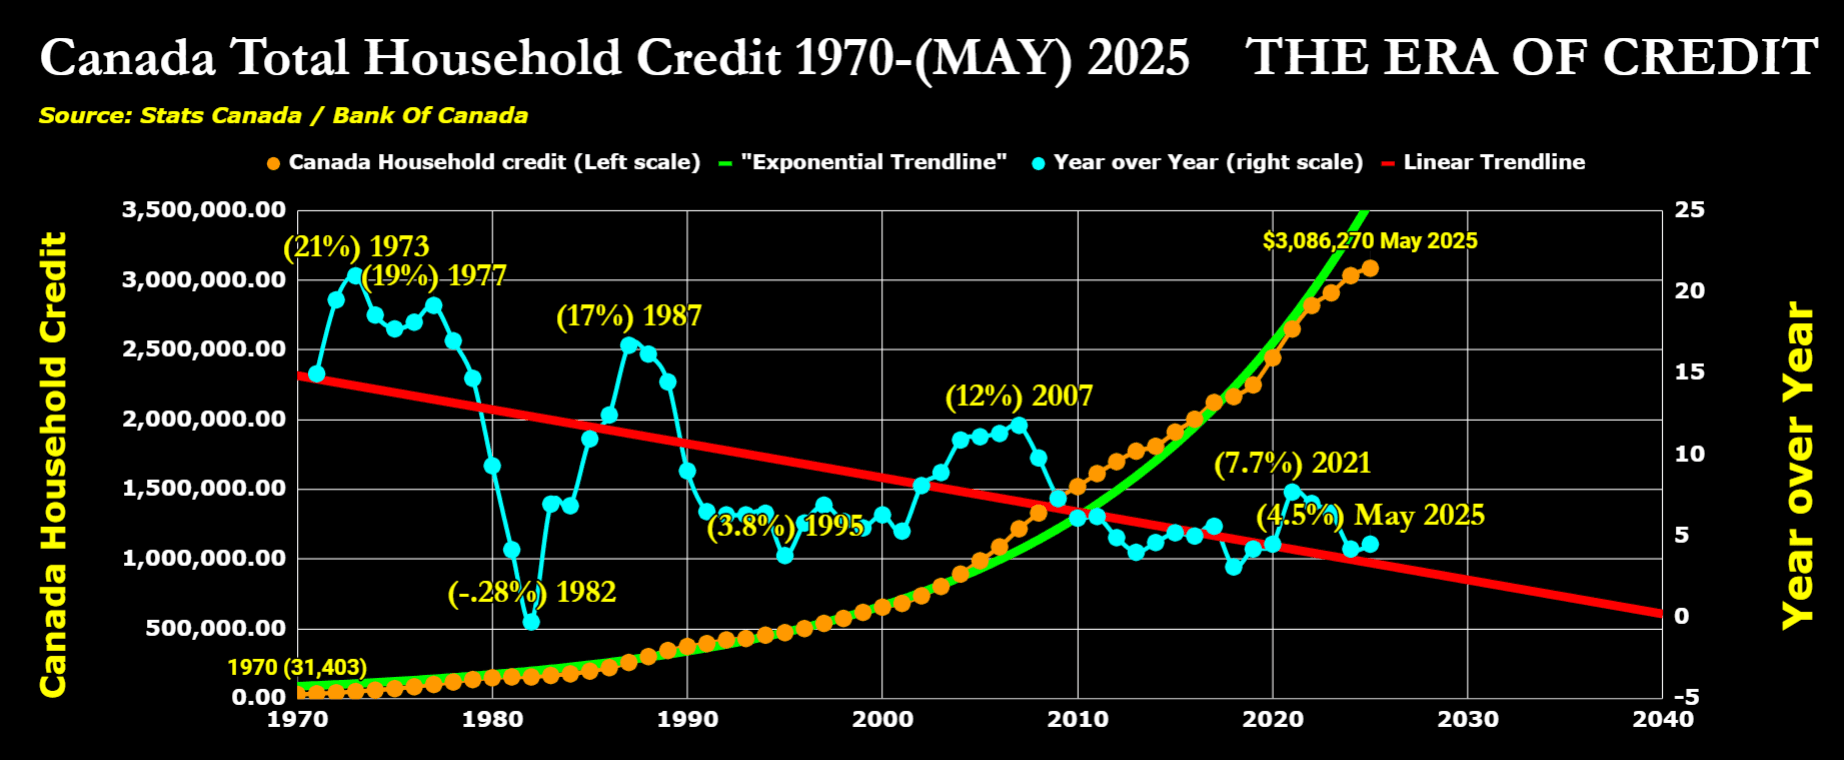
The "Era of Credit" is mathematically ending - here's what the data reveals about the 2030s transformation 📊 Canadian household credit: 9,600% growth from 1970-2025 ($31K → $3M+). But the Rate of Change (ROC) tells the REAL story of momentum breakdown: 📉 Peak Velocity (21%) - 1973 oil crisis 📉 Massive crash to -28% by[...]

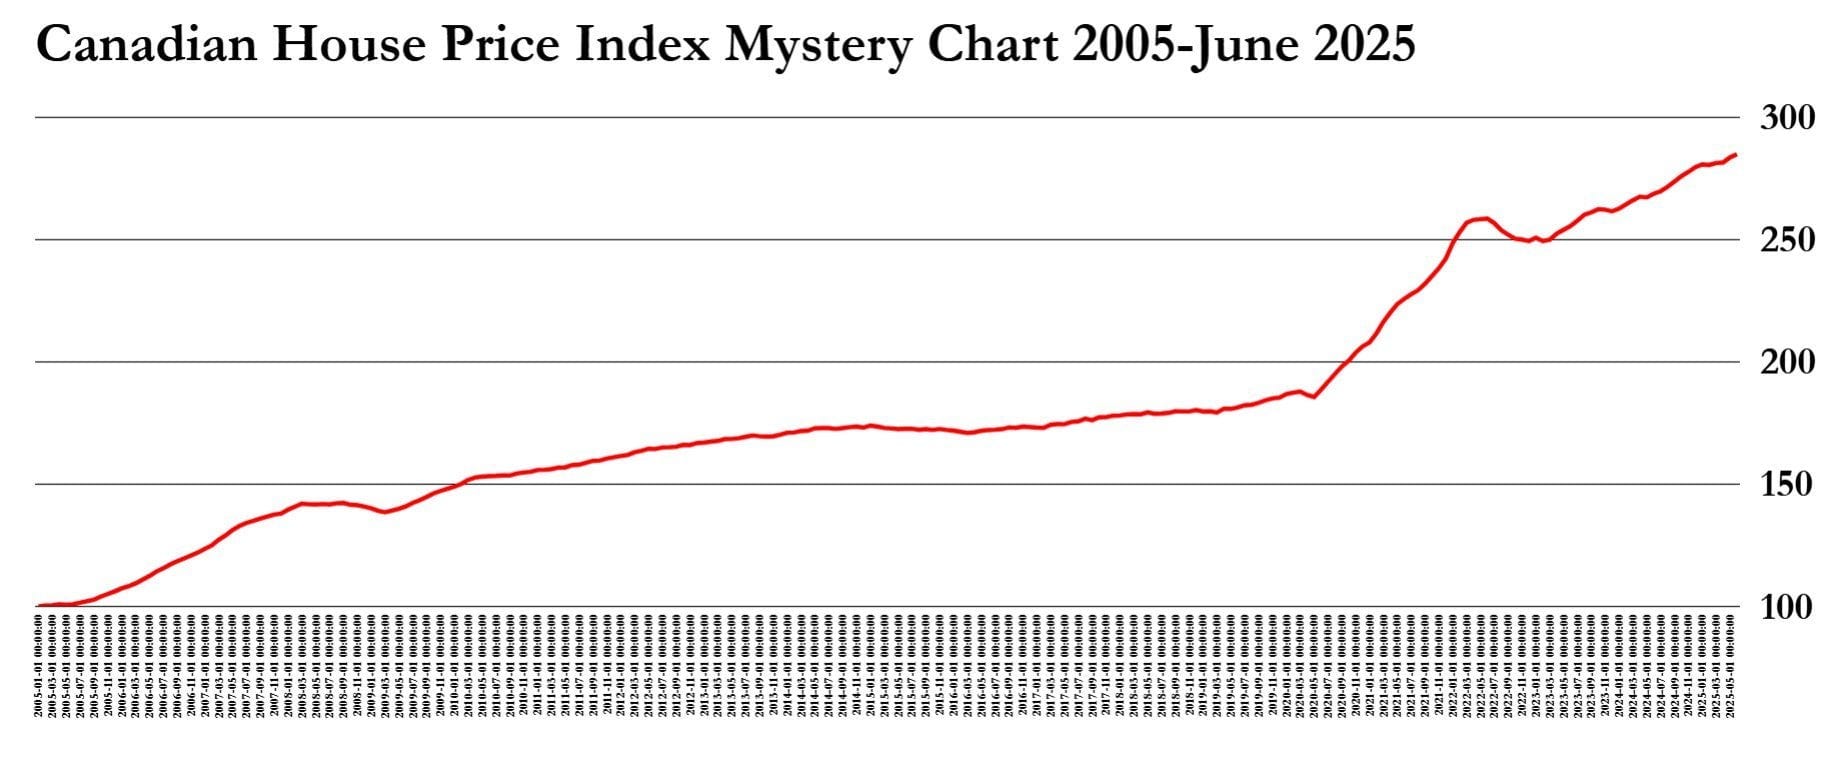
The New Home Price Index chart paints a clear picture: the Canadian real estate market seems stuck in a bearish cycle. As of December 2024, the latest data indicates a continuation of this downward trend, suggesting a sustained period of weaker demand and lower home prices. This trend is typical of a bear[...]
Canada's Perfect Storm: High Debt Service Ratios Meet Political Risk The latest Bank for International Settlements (BIS) data release for H2 2024 shows a concerning pattern for Canada's private sector Debt Service Ratio (DSR). At 24.9%, Canada's DSR towers above other developed economies, painting a picture of an economy increasingly vulnerable to financial and political[...]
Canada's Household Debt: The End of the Credit Era? The story of Canadian household debt over the past five decades reads like a cautionary tale. Recent data from Statistics Canada and the Bank of Canada paints a stark picture: Canadian households have embarked on a borrowing spree that has taken total household credit from a[...]

Understanding the Economic Seasons: A Look at the Kondratieff Wave The Kondratieff wave, named after the Russian economist Nikolai Kondratiev who first proposed the theory in the 1920s, offers a fascinating lens through which to view economic cycles. According to this theory, the global economy experiences long-term cycles of boom and bust, spanning several[...]

Think of great investors as better at reading the odds, but with an important twist: they also understand that what you pay for changes those odds dramatically. It's like the lottery example but now consider the ticket price. If a lottery ticket costs $1, and you have a decent chance of winning $100, that might[...]

In February 1989, Toronto's real estate market was at the peak of a housing bubble. The high five-year fixed mortgage rate of 12.25% at the time reflects a general environment of high interest rates used to curb inflation throughout the late 1980s. While initially not deterring buyers due to speculative investment and demand outpacing supply,[...]

US Stock Valuations Have Reached Extreme Levels: A 95-Year Perspective. In the ongoing debate about US stock market valuations, a striking chart from the Financial Times' Daily Shot presents a compelling visualization of how extraordinary current market conditions are. By examining the ratio of non-financial market capitalization to corporate gross value-added from 1929 to 2024,[...]

The sharp downturn shown in the chart illustrates a K-wave's peak and subsequent downturn, where excessive financialization has led to economic vulnerabilities. This phase could be marked by a correction or a deflationary period where asset prices adjust and economic realities come to the forefront. Understanding this cycle is crucial for forecasting future economic trends[...]

Toronto's housing affordability trends from 1976 to 2024 reflect a sharp and persistent decline in affordability, as seen in the dramatic rise in the price-to-income ratio. Here's a detailed analysis: Long-Term Trend in Housing Affordability The price-to-income ratio (inflation-adjusted) rose from 4.4 in 1976 to 16.0 in 2023, reflecting a 512% increase in real home[...]

1/ Lower rates = bigger market. More folks can afford loans when monthly payments drop. Simple math: same house, lower payment = more potential borrowers. 2/ Quality boost: When rates fall, existing borrowers breathe easier. Their debt payments shrink relative to income. Default risk ⬇️ 3/ The fixed-income goldmine: Banks holding long-duration bonds saw[...]

Key Observations Real Boom (Green Box): This period refers to historically robust population growth driven by organic economic factors. These could include: Natural Population Growth: High birth rates or family sizes. Economic Prosperity: Agricultural or industrial expansions providing stable economic opportunities. Immigration Waves: Large-scale immigration, particularly during Canada's nation-building era in the late 19th[...]